# Setting up Data Set for Animation
dataSet = np.array([x, y, z]) # Combining our position coordinates
numDataPoints = len(t)
你也可以改动上面的时间和位置数组来创建新的轨迹。我们接下来要用 dataSet和numDataPoints变量定义动画函数。
为了使我们的图形动画化,我们将用animation类中的一个名为FuncAnimation的函数。
你可以在此处访问关于这两个的文档:
https://matplotlib.org/stable/api/animation_api.html
FuncAnimation要求我们创建自己的函数来更新线、点等,在这里我们将其定义为animate_func 。
def animate_func(num):
    ax.clear()  # Clears the figure to update the line, point,
                # title, and axes    # Updating Trajectory Line (num+1 due to Python indexing)
    ax.plot3D(dataSet[0, :num+1], dataSet[1, :num+1],
              dataSet[2, :num+1], c='blue')    # Updating Point Location
    ax.scatter(dataSet[0, num], dataSet[1, num], dataSet[2, num],
               c='blue', marker='o')    # Adding Constant Origin
    ax.plot3D(dataSet[0, 0], dataSet[1, 0], dataSet[2, 0],
               c='black', marker='o')    # Setting Axes Limits
    ax.set_xlim3d([-1, 1])
    ax.set_ylim3d([-1, 1])
    ax.set_zlim3d([0, 100])
    # Adding Figure Labels
    ax.set_title('Trajectory \nTime = ' + str(np.round(t[num],
                 decimals=2)) + ' sec')
    ax.set_xlabel('x')
    ax.set_ylabel('y')
    ax.set_zlabel('z')
首先要注意传递给animate_func的num变量。
这是当前动画步骤的索引。当我们将animate_func传递给FuncAnimation时,它会迭代我们的num变量。我们可以使用该变量来迭代所有我们之前创建的数据集。
这个函数从清除图形开始。这将删除线、点、原点、轴标签和标题。然后它添加更新的
轨迹线
(从0到num )
和点位置
(在步骤num处)
。我们的原点在此图中保持不变,因此你会注意到num没有显示,因为我们没有更改原点。接下来,该函数定义我们不变的
轴限制
(unchanging axis limits)
。如果你希望轴随着数字的增加而改变
(使轴变为动态)
,那么你可以删除轴限制。
最后,该函数定义了我们的标题和轴标签。
标签很简单,只有我们的x 、 y和z用于坐标。作为一点额外功能,我们有一个动态标题,显示轨迹的时间数组t。我们显示它
(四舍五入到小数点后第二位)
,并在每次迭代时更新它。
请注意,这些不是实时的秒数。
绘制我们的动画
最后一步是使用FuncAnimation绘制我们的动画。
我们首先创建具有三维轴的图形对象。然后我们使用FuncAnimation ,它将图形、我们之前创建的动画函数、间隔值
(interval value)
和帧值
(frames)
作为输入。间隔是以毫秒为单位的帧之间的延迟,帧是你想显示的帧数。最后两个是可选参数,但如果你想调整动画的外观,就需要包含它们。
# Plotting the Animation
fig = plt.figure()
ax = plt.axes(projection='3d')
line_ani = animation.FuncAnimation(fig, animate_func, interval=100,
                                   frames=numDataPoints)
plt.show()
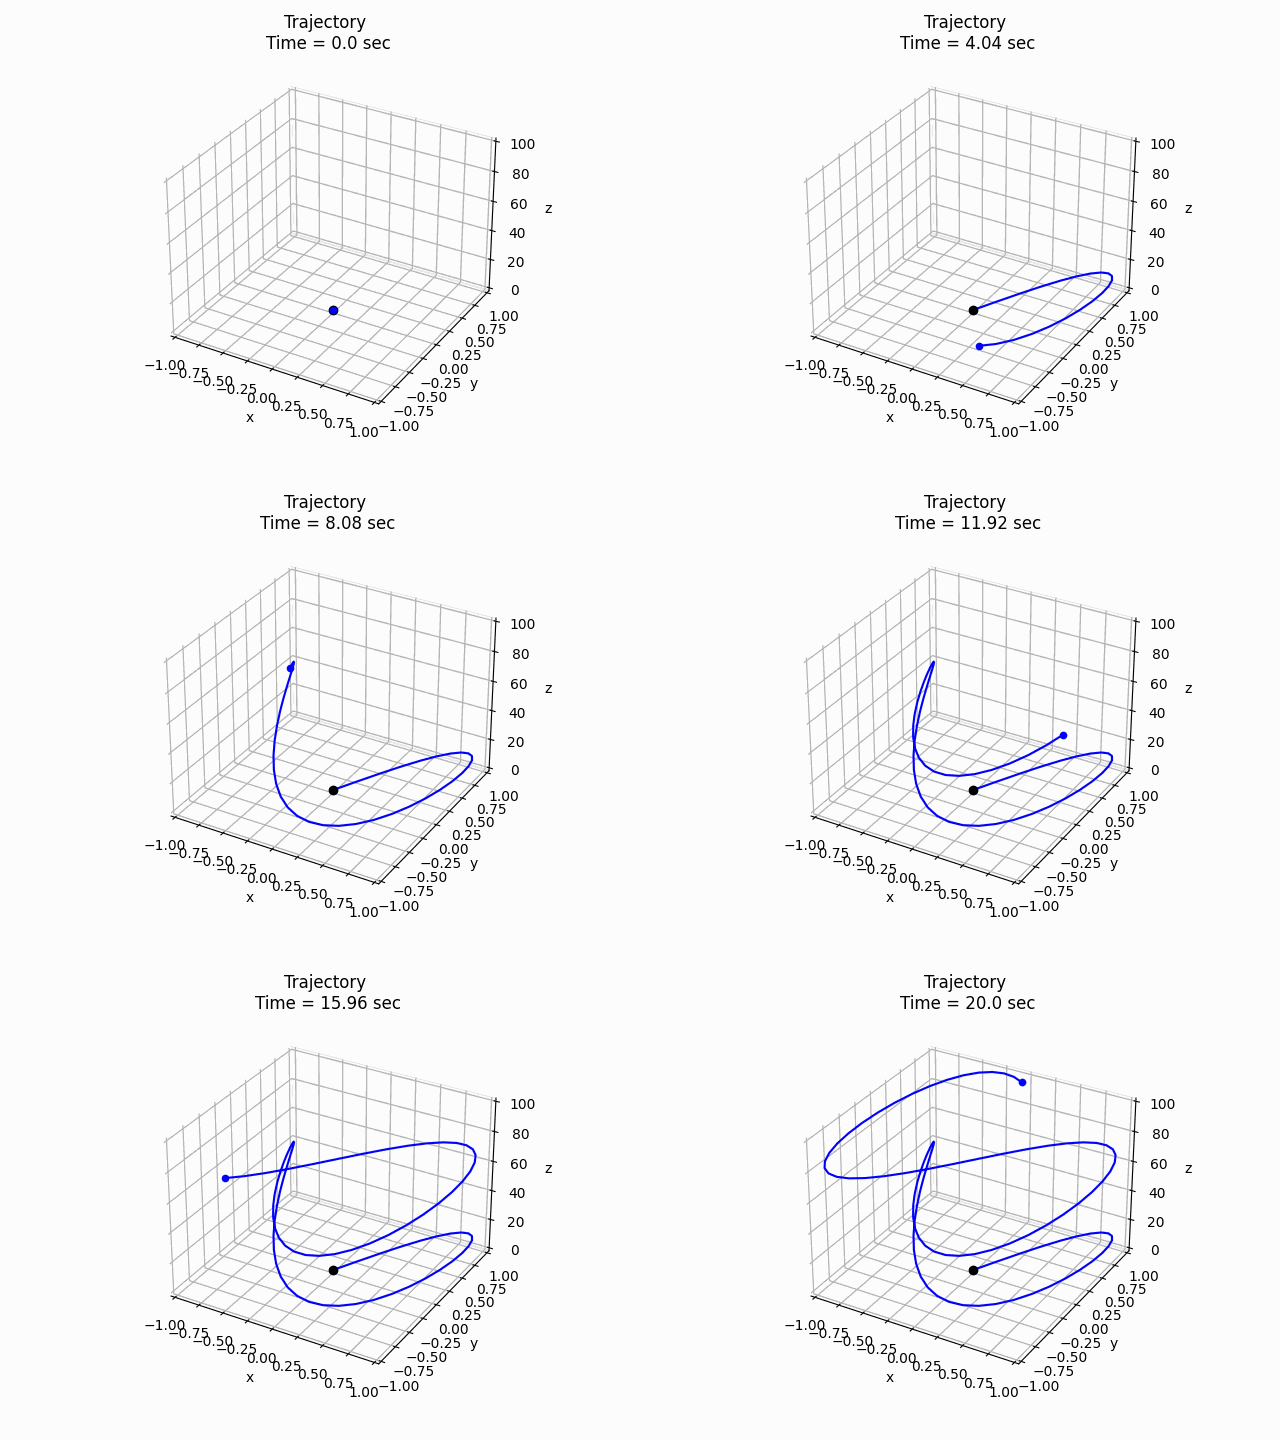
现在,你可以运行代码了,如果正确完成,你的绘图应如下所示
(点的速度可能不同)
:
 轨迹动画【作者创作】
保存我们的动画
如果想把动画保存为.gif文件,你可以用以下代码来完成。
# Saving the Animation
f = r"c://Users/(Insert User)/Desktop/animate_func.gif"
writergif = animation.PillowWriter(fps=numDataPoints/6)
line_ani.save(f, writer=writergif)
你需要选择一个位置来保存它,并将其存储为f变量。你可以在PillowWriter中调整每秒帧数fps变量。我将numDataPoints变量
(FuncAnimation中的帧数)
除以6 ,使动画长度为6秒。
这就是本文的全部内容。感谢你的阅读!如果不想错过更多 Python 和数据分析文章,请关注我们的公众号!你还可以订阅我们的YouTube频道,观看大量数据科学相关公开课:
https://www.youtube.com/channel/UCa8NLpvi70mHVsW4J_x9OeQ
;在LinkedIn上关注我们,扩展你的人际网络!
https://www.linkedin.com/company/dataapplab/
原文作者:Zack Fizell
翻译作者:Jiawei Tong
美工编辑:过儿
校对审稿:Jiawei Tong
原文链接:
https://towardsdatascience.com/how-to-animate-plots-in-python-2512327c8263
May 17, 2022
|
|
Tags:
数据分析