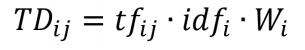
其中i、j是对排序后的词汇的编号,p、q是对文本序列的编号,fw
i
s
p
为词汇
w
i
在序列
s
p
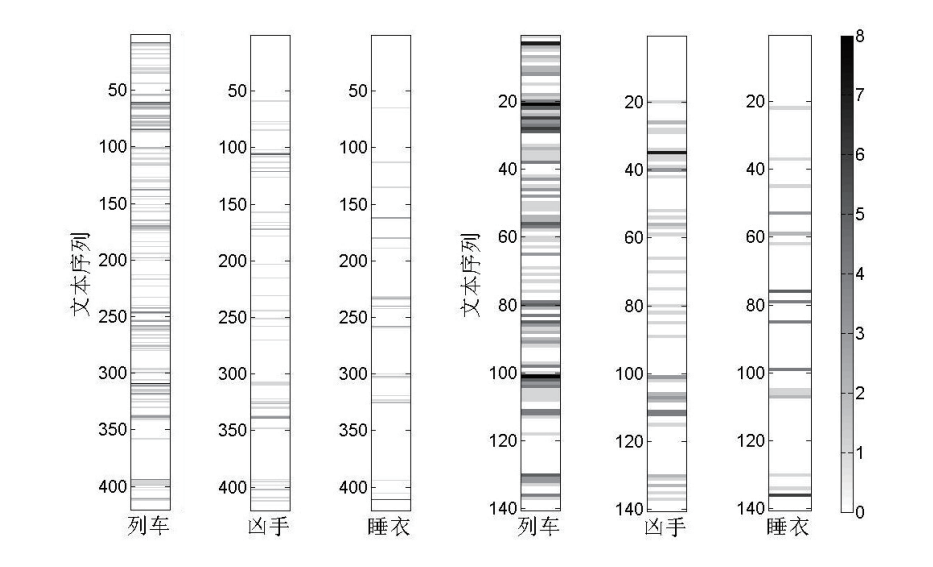
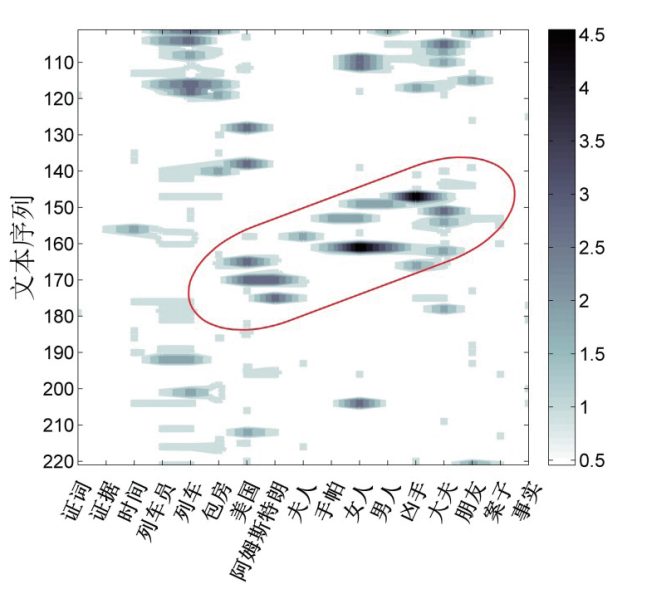
中的词频。e指数是为了量化词汇间的位置距离与彼此的关联性——在时序轴上的距离越远(|p-q|越大),关联越小。当两个词汇处于同一时序中,即p=q时,也就是通常所说的共现状态,这种情况意味着两个词汇在文本中具有最大的关联性。例如,在图1所示的《东方快车谋杀案》的文本中,我们如果选择列车、凶手、睡衣三个词汇进行分析,在“列车—凶手—睡衣”这一排序下,三个词汇的编号分别为
w1
、
w2
、
w3
,而整个文本根据左侧的粒度被分为420个时间序列,即
s1
至
s420
。根据公式2,这种排序方式对应的关联系数的计算方式为:
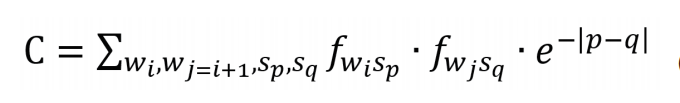
从表1可知,第三种排序方式对应的关联系数最大,所以在进行时序图拼接时应该按照这样的方式排列不同词汇的顺序。在进行实际研究时,我们选取的词汇量当然远不止3个,其排列方式也非常多。寻找最优排列的计算量随词汇量的增大而显著增加,我们一般选取50个左右的关键词,这样可以在文本叙事结构的完整呈现和计算资源的消耗上取得较好的平衡。然而,如果通过遍历的方式计算出所有词汇排序方式所对应的关联系数,计算量将极为巨大,因此,我们设计了一种依序堆叠的算法,极大地减少了所需的计算量。可以证明,这种“堆叠算法”的排序结果在只考虑共现关联时,即
C=
Σ
w
i
,w
j
=i+1,s
p
fw
i
s
p
·
fw
i
s
p
时,其与遍历算法所得到的结果是一致的。在附录中,我们对这一结论给出了详细的证明。而由于e指数随着时序差值的迅速衰减性,在大部分情况下,共现关联占据了总关联数值的绝大部分。因此,即便在考虑了所有关联项的一般情况下,这种堆叠算法也可以很好地逼近遍历算法的结果。事实上,在词汇量较少的情况下(不超过6个),我们比较了堆叠算法和遍历算法的排序,两者得到的结果是一样的。
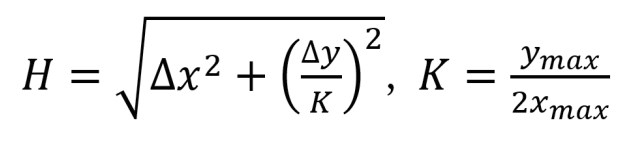
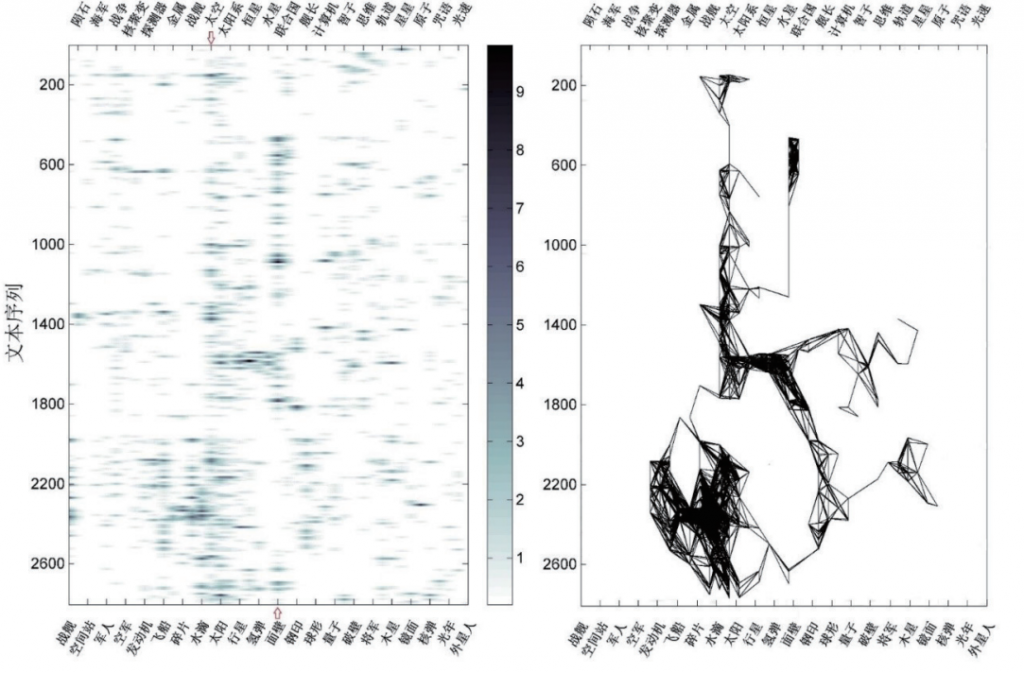
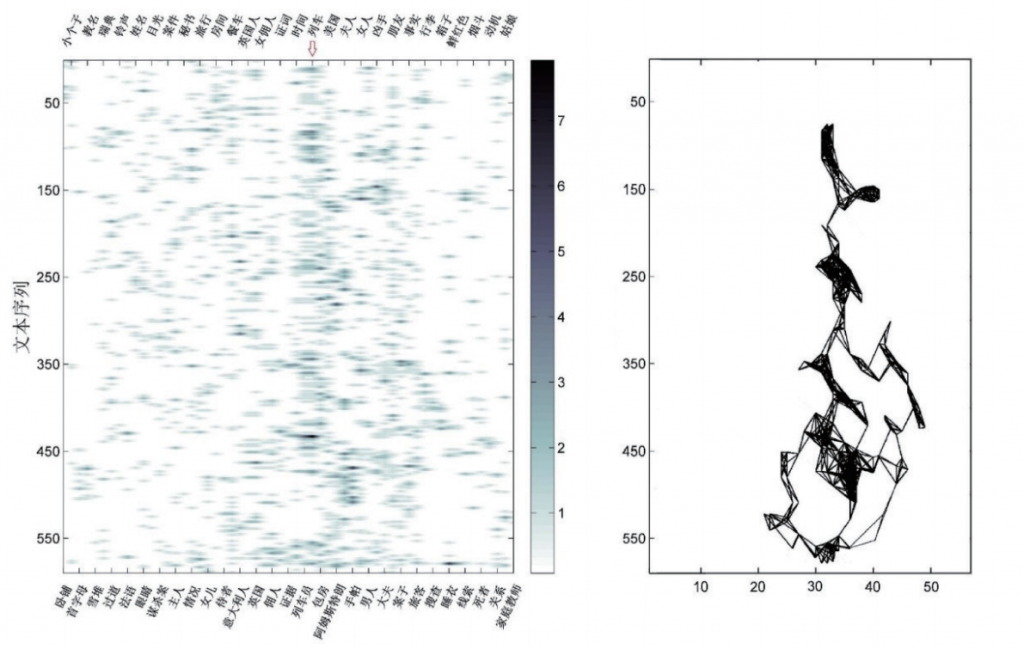
其中∆
x
是两个热点的横轴数值差,∆
y
是两个热点的纵轴数值之差。考虑到文本序列的数量显著大于词汇的数量,因此对纵轴距离进行了压缩处理,压缩参数K的取值为纵轴最大值除以两倍的横轴最大值。通过这样的处理,等效于将原图缩放为了一个纵轴长度为横轴两倍的长方形区域,与实际看到的图像更为接近。图2右侧就是通过这种方式得到的热点网络图。与左侧相比,它更为清晰地展示了文本的叙事结构。
The Puzzle-solving Narration in Science Fiction and Detective Novels: A Distant-reading and Visualization Study Based on Word Frequency Dynamics
Liu Yang
Abstract:
By integrating the one-dimensional word frequency distribution chain of a single word and optimizing the correlation coefficient, a two-dimensional image reflecting the narrative structure of the text can be obtained. Taking
The Three Body Problem 2
and
Murder On the Orient Express
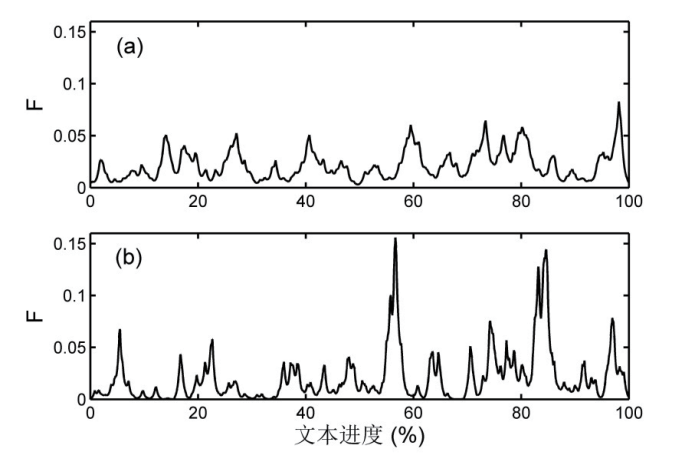
as examples, by analyzing the correlated word-frequency sequence diagram, we can intuitively observe the structural characteristics of the narrative main line, logical deduction, story climax and puzzle-solving shrinkage. In the image of word frequency clustering function, there are specific peaks in the climax and puzzlesolving sections. After analyzing the averaged word frequency clustering function of a large number of texts, it is found that the puzzle-solving peak is the most significant feature in the image of detective novel group, which indicates that the puzzle-solving narration is widely used in the detective novels. This method based on dynamic analysis of word frequency is an effective distance-reading and visualization scheme for narrative text.
Keywords:
Narrative Structure; Word Frequency Dynamics; Puzzle-solving Narration;Distant-reading; Visualization
———————————————————————————————————————–
(编辑:赵薇)
[1]R. A. Freeman,“The Art of the Detective Story,”
Nineteenth-Century and After
, London: Dodd, Mead, 1924.
[3]A. Don et al, “Discovering Interesting Usage Patterns in Text Collections: Integrating Text Mining with Visualization,”Proceedings of the Sixteenth ACM Conference on Information and Knowledge Management, CIKM 2007, Lisbon, Portugal, November 6-10,2007.
[6]Q. Hu et al, “Dynamic Evolution of Sentiments in
Never Let Me Go
: Insights from Multifractal Theory and its Implications for Literary Analysis,”
Digital Scholarship in the Humanities
, vol. 36, no. 2, 2021, pp. 322- 332; Q. Hu et al, “Fractal Scaling Laws for the Dynamic Evolution of Sentiments in
Never Let Me Go
and their Implications for Writing, Adaptation and Reading of Novels,”
World Wide Web
, vol. 24, 2021, pp. 1147- 1164.
[6]K. L. Nielbo et al, “A Curious Case of Entropic Decay: Persistent Complexity in Textual Cultural Heritage,”
Digital Scholarship in the Humanities
, vol. 34, no. 3, 2019, pp. 542-5421.
[7]Teresa Snelgrove, “A Method for the Analysis of the Structure of Narrative Texts,”
Literary & Linguistic Computing
, vol. 3, 1990, pp. 221-225.
[8]L. Hess, C. Bary, “Narrator Language and Character Language in Thucydides: A Quantitative Study of Narrative Perspective,”
Digital Scholarship in the Humanities
, vol. 35, no. 3, 2020, p. 557.